
Key facts
- The wettest day in San Diego's official climate record since 1850 was December 2, 1854, with 3.34 in. of rain. ACIS daily record, official San Diego climate record (SANthr)
- Jan. 22, 2024, with 2.73 inches at the airport, ranks fourth among all days in San Diego's official climate record since 1850. ACIS daily record, official San Diego climate record (SANthr)
- FEMA records 904 National Flood Insurance Program claims in San Diego's 32 home ZIP codes as of November 14, 2026, with $27,000,037 paid. FEMA OpenFEMA NFIP Redacted Claims v3
- 1
San Diego's official climate record, the ACIS San Diego Area series, has daily rain from October 1, 1850 through November 17, 2026; it was kept at the downtown Weather Bureau office from 1850 to 1940 and at San Diego International Airport (Lindbergh Field) since 1939.
Source: ACIS station metadata: San Diego Area (SANthr), San Diego WBO and San Diego International Airport.
- 2
The wettest day in San Diego's official climate record since 1850 was December 2, 1854, with 3.34 in. of rain.
Source: ACIS daily record, official San Diego climate record (SANthr), calculated by San Diego Water Damage Watch on November 18, 2026.
- 3
The second wettest day in San Diego's official record since 1850 was April 5, 1926, with 3.23 in..
Source: ACIS daily record, official San Diego climate record (SANthr), calculated by San Diego Water Damage Watch on November 18, 2026.
- 4
Jan. 22, 2024, with 2.73 inches at the airport, ranks fourth among all days in San Diego's official climate record since 1850.
Source: ACIS daily record, official San Diego climate record (SANthr), calculated by San Diego Water Damage Watch on November 18, 2026.
- 5
San Diego's official record has 625 days from 1850 to 2026 with 0.70 in. of rain or more, the wettest 1% of days.
Source: ACIS daily record, official San Diego climate record (SANthr), calculated by San Diego Water Damage Watch on November 18, 2026.
- 6
99 of San Diego's days with 0.70 in. of rain or more since 1850 fell on or after Jan. 1, 2000.
Source: ACIS daily record, official San Diego climate record (SANthr), calculated by San Diego Water Damage Watch on November 18, 2026.
- 7
San Diego's official record has 34 days with 2 inches of rain or more between 1850 and 2026.
Source: ACIS daily record, official San Diego climate record (SANthr), calculated by San Diego Water Damage Watch on November 18, 2026.
- 8
The wettest calendar year in San Diego's official record is 1884, with 27.59 in. of rain, followed by 1941 with 24.93 in..
Source: ACIS daily record, official San Diego climate record (SANthr), calculated by San Diego Water Damage Watch on November 18, 2026.
- 9
The wettest single month in San Diego's official record since 1850 is December 1921, with 9.26 in..
Source: ACIS daily record, official San Diego climate record (SANthr), calculated by San Diego Water Damage Watch on November 18, 2026.
- 10
A normal year in San Diego brings 9.79 in. of rain at the airport, the sum of its 1991-2020 monthly normals.
Source: NCEI 1991-2020 normals via ACIS, San Diego record, calculated by San Diego Water Damage Watch on November 18, 2026.
- 11
February is San Diego's wettest month in the 1991-2020 normals, at 2.20 in..
Source: NCEI 1991-2020 normals via ACIS, San Diego record, calculated by San Diego Water Damage Watch on November 18, 2026.
- 12
The coldest morning in San Diego's official climate record is 25°F on Jan. 7, 1913, and the hottest afternoon is 111°F on Sept. 26, 1963.
Source: ACIS daily record, official San Diego climate record (SANthr), calculated by San Diego Water Damage Watch on November 18, 2026.
- 13
The City of San Diego reported that the National Weather Service ranked Jan. 22, 2024 as the fourth wettest day in San Diego history.
Source: City of San Diego: Record Amount of Rain Causes Widespread Flooding (Jan. 22, 2024).
- 14
Six of the City of San Diego's 15 stormwater pump stations were overwhelmed in the storm of Jan. 22, 2024, and its Stormwater Department took more than 500 calls.
Source: City of San Diego: Teams Assess Damage After the Storm (Jan. 24, 2024).
- 15
The San Diego River at Fashion Valley crested at 19.3 feet in January 1916, the highest crest on the National Weather Service list for that gauge.
- 16
On the current datum, the San Diego River's highest listed crest at Fashion Valley is 16.3 feet in February 1980, just under the 16.5-foot major flood stage.
- 17
FEMA records 904 National Flood Insurance Program claims in San Diego's 32 home ZIP codes as of November 14, 2026, with $27,000,037 paid.
Source: FEMA OpenFEMA NFIP Redacted Claims v3, calculated by San Diego Water Damage Watch on November 14, 2026.
- 18
2024 is the year of loss with the most NFIP flood claims in San Diego's home ZIP codes, 137, followed by 1998 with 75.
Source: FEMA OpenFEMA NFIP Redacted Claims v3, calculated by San Diego Water Damage Watch on November 14, 2026.
- 19
FEMA's NFIP data lists 117 flood claims in San Diego's home ZIP codes with Jan. 22, 2024 as the date of loss, more than any other single date.
Source: FEMA OpenFEMA NFIP Redacted Claims v3, calculated by San Diego Water Damage Watch on November 14, 2026.
- 20
ZIP 92109 (San Diego) has the most NFIP flood claims of San Diego's home ZIP codes, 139, as of November 14, 2026.
Source: FEMA OpenFEMA NFIP Redacted Claims v3, calculated by San Diego Water Damage Watch on November 14, 2026.
- 21
ZIP 92113 (San Diego) has the largest total NFIP flood payments of San Diego's home ZIP codes, $10,510,913, as of November 14, 2026.
Source: FEMA OpenFEMA NFIP Redacted Claims v3, calculated by San Diego Water Damage Watch on November 14, 2026.
- 22
About 0.4% of homes in San Diego's 32 home ZIP codes had a residential NFIP flood policy in force on September 1, 2026.
Source: FEMA OpenFEMA NFIP Redacted Policies v3, calculated by San Diego Water Damage Watch on November 14, 2026.
- 23
About 53% of housing units in the 30 ZIP codes mostly inside San Diego city limits were built before 1980, according to Census estimates.
Source: U.S. Census Bureau, ACS 5-year 2020-2024, tables B25034 and B25035, calculated by San Diego Water Damage Watch on November 14, 2026.
- 24
FEMA's declarations data names San Diego County in 19 storm or flood disaster and emergency declarations, most recently DR-4758 for the storm of January 2024.
Source: FEMA OpenFEMA Disaster Declarations Summaries v2, calculated by San Diego Water Damage Watch on November 14, 2026.
San Diego rainfall, year by year
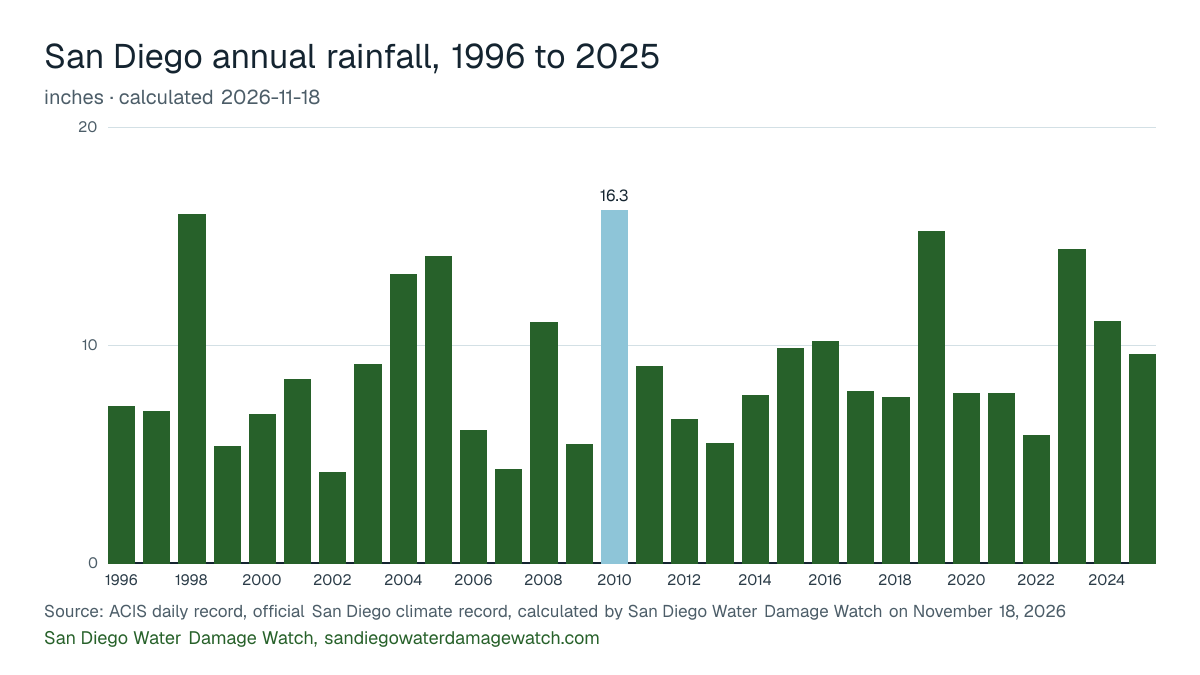
In San Diego's official climate record, 2010 was the wettest of the last 30 full years with 16.26 inches, against a 1991-2020 normal year of 9.79 inches.
The numbers behind the chart
| Year | Rain (in.) |
|---|---|
| 1996 | 7.27 |
| 1997 | 7 |
| 1998 | 16.05 |
| 1999 | 5.43 |
| 2000 | 6.9 |
| 2001 | 8.47 |
| 2002 | 4.23 |
| 2003 | 9.18 |
| 2004 | 13.29 |
| 2005 | 14.11 |
| 2006 | 6.15 |
| 2007 | 4.37 |
| 2008 | 11.11 |
| 2009 | 5.5 |
| 2010 | 16.26 |
| 2011 | 9.08 |
| 2012 | 6.64 |
| 2013 | 5.57 |
| 2014 | 7.77 |
| 2015 | 9.89 |
| 2016 | 10.23 |
| 2017 | 7.92 |
| 2018 | 7.65 |
| 2019 | 15.28 |
| 2020 | 7.83 |
| 2021 | 7.85 |
| 2022 | 5.9 |
| 2023 | 14.43 |
| 2024 | 11.16 |
| 2025 | 9.65 |
The storms behind these numbers are on the rainfall and storm history, and each ZIP's claims, flood policies and home age are on the San Diego flood map by ZIP.
Cite this page: “Water Damage in San Diego: the Numbers.” San Diego Water Damage Watch, https://sandiegowaterdamagewatch.com/san-diego-water-damage-numbers/. Updated November 18, 2026.