
Key facts
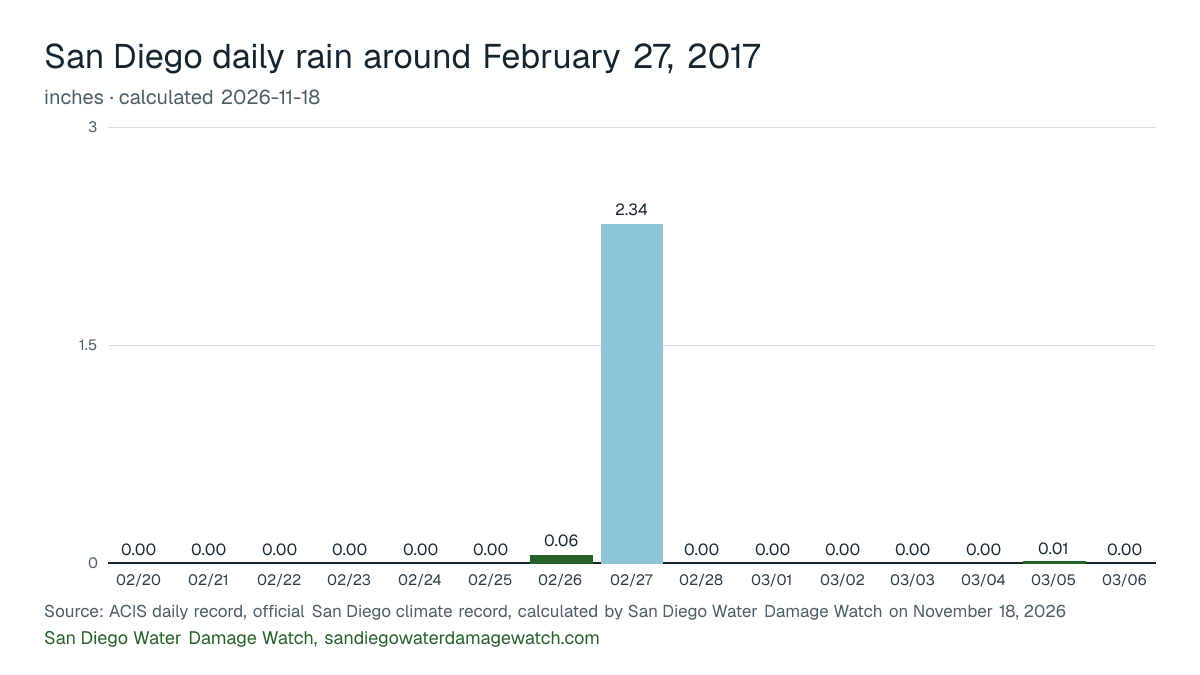
- San Diego's official climate record shows 2.34 in. of rain on February 27, 2017 (calculated by San Diego Water Damage Watch on November 18, 2026). ACIS daily record, official San Diego climate record
- That ranks 16th among all 62,354 days in the record since 1850, and 3rd among the 4,821 February days on file (calculated by San Diego Water Damage Watch on November 18, 2026). ACIS daily record, official San Diego climate record
- The day's rain equals 106% of a normal February's total of 2.20 in. (1991-2020 normals, calculated by San Diego Water Damage Watch on November 18, 2026). ACIS daily record, official San Diego climate record
- With the day next to it, the two-day total was 2.40 in. (calculated by San Diego Water Damage Watch on November 18, 2026). ACIS daily record, official San Diego climate record
- It is the wettest February 27 in the record (calculated by San Diego Water Damage Watch on November 18, 2026). ACIS daily record, official San Diego climate record
Rain on the days around it
San Diego's official climate record, day by day from a week before February 27, 2017 to a week after, with the report day marked.
The numbers behind the chart
| Date | Rain | Low |
|---|---|---|
| February 20, 2017 | 0.00 in. | 56°F |
| February 21, 2017 | 0.00 in. | 56°F |
| February 22, 2017 | 0.00 in. | 56°F |
| February 23, 2017 | 0.00 in. | 52°F |
| February 24, 2017 | 0.00 in. | 47°F |
| February 25, 2017 | 0.00 in. | 47°F |
| February 26, 2017 | 0.06 in. | 52°F |
| February 27, 2017 | 2.34 in. | 54°F |
| February 28, 2017 | 0.00 in. | 53°F |
| March 1, 2017 | 0.00 in. | 48°F |
| March 2, 2017 | 0.00 in. | 50°F |
| March 3, 2017 | 0.00 in. | 50°F |
| March 4, 2017 | 0.00 in. | 53°F |
| March 5, 2017 | 0.01 in. | 55°F |
| March 6, 2017 | 0.00 in. | 52°F |
The five closest days in the record
| Date | Rain |
|---|---|
| December 15, 1938 | 2.35 in. |
| March 24, 1906 | 2.36 in. |
| December 23, 1940 | 2.31 in. |
| February 9, 1901 | 2.39 in. |
| January 4, 1995 | 2.24 in. |
Federal disaster declarations
No FEMA storm or flood declaration for San Diego County covers this date.
Source: FEMA OpenFEMA Disaster Declarations Summaries v2.
History, not a forecast: the ZIPs with the most flood claims
Context only: the three San Diego home ZIPs with the most NFIP flood claims across all years on record, not claims from this day.
- ZIP 92109: 139 claims on record
- ZIP 92113: 125 claims on record
- ZIP 92037: 109 claims on record
Source: FEMA OpenFEMA NFIP Redacted Claims v3, calculated by San Diego Water Damage Watch on November 14, 2026. Each ZIP's numbers are on the San Diego flood map by ZIP.
What to check at home after a day like this
- Roots and cooking grease are the City's two main causes of lateral spills, and a downpour finds the weak spot. If a floor drain or toilet gurgles, stop running water and call 619-515-3525.
- The City asks residents to set trash bins two to three feet back from the curb so runoff can reach the storm drain. Clear leaves off the inlet in front of the house too.
- Many roofs here go months without a real test. A brown ring on the ceiling after the first big storm means water is sitting above it; photograph it with the date.
The printable emergency checklist and the flood cleanup page have the full steps.
From official sources
The official record shows 2.34 inches at the airport on Feb. 27, 2017. The National Weather Service crest list for the San Diego River at Fashion Valley has 14.15 feet that evening, above the 13.5-foot moderate flood stage and topped only by the crests of 1916 and 1980.
Sources: ACIS daily record for the official San Diego climate record (SANthr), kept at the downtown Weather Bureau office from 1850 to 1940 and at San Diego International Airport (Lindbergh Field) since 1939; NCEI 1991-2020 normals via ACIS; FEMA OpenFEMA. Method and the report rule: sources and methods.
Cite this page: “San Diego storm report: 2.34 in. of rain, February 27, 2017.” San Diego Water Damage Watch, https://sandiegowaterdamagewatch.com/san-diego-rainfall-history/2017-02-27/. Updated November 18, 2026.